Riprendo un segnalazione lasciata dal nostro Fano, in un precente articolo, per comunicarvi l’uscita di una nuova carta, che verrà pubblicata sul Journal of Atmospheric and Solar-Terrestrial Physics. Carta, realizzata dal professore Sverre Holm del dipartimento di informatica dell’università di Oslo, http://arxiv.org/pdf/1307.1086.pdf
e che a mio modesto parere, si aggiunge a tutta un’altra serie di lavori scientifici, costruiti ad”hoc“, in quest’ultimo anno e mezzo, per gettare dubbi, caos e quant’altro….non solo su i lavori di Nicola Scafetta, ma anche su tutto quel palco di lavori scientifici, che nicola o altri ricercatori, hanno realizzato e che evidenziano una chiara ciclicità naturale che interessa tutto l’assetto climatico del nostro pianeta.
Sappiamo tutti quanto sia estremamente complesso sviscerare da un punto di vista matematico la sola variabilità climatica del nostro pianeta, immaginatevi quando ci mettiamo dentro i pianeti, il Sole e il complesso gioco di forze mareali elettromagnetiche e gravitazionali…
Prima che la carta venisse pubblicata sul blog di Antony watts, Sverre Holm, pubblica questo articolo, sul suo blog e getta una frase che dal mio modesto punto di vista e molto significativa e chiarisce molto bene la vera problematica che circonda l’attuale metodo scientifico e lo studio di queste tematiche :
Jeg er jo ingen klimaforsker, men jeg har jobbet mye med sammenhenger mellom signaler.
Che tradotto significa :
Io non sono uno scienziato del clima, ma ho lavorato molto con le correlazioni tra segnali

Questo articolo non ha la pretesa di lanciare un sasso contro il lavoro strettamente matematico e sicuramente significativo del prof.Sverre Holm, nella quale si legge
La periodicità presunta di circa 30 anni nella carta di Scafetta (2010) non è davvero
presentare nella serie clima e potrebbe essere un artefatto dovuto a una combinazione
del modello di sovradattamento e dovuto a sbavature all’assunzione di invarianze temporali sui dati,
ma probabilmente affermare che Sverre Holm ha ragione, ma che Scafetta non ha torto …. 🙂
Forse …. se il prof.Sverre Holm allargasse gli studi alla climatologia, astronomia etc….le cose cambierebbero…ma siamo proprio sicuri che abbia vero interesse nel cercare la riposta (il vero ricercatore) al perchè del ciclo di 60 anni ? mmmhhh…..
P.S. Si veda i riferimenti
Riferimenti :
http://www.nature.com/ncomms/journal/v2/n2/full/ncomms1186.html
Here, we show that distinct, ~55- to 70-year oscillations characterized the North Atlantic ocean-atmosphere variability over the past 8,000 years.
http://www.fao.org/docrep/005/y2787e/y2787e01.pdf
The same 60-70 year periodicity has also been characteristic for the long-term dynamics of some climatic
and biological indices for the last 150 years (Klyashtorin 1998).
http://www.tandfonline.com/doi/abs/10.1080/17451000802512283
Long-term changes of Atlantic spring-spawning herring and Northeast Arctic cod commercial stocks also show 50–70-year fluctuations that are synchronous with the fluctuations of climatic indices.
http://www.sciencedirect.com/science/article/pii/S0273117713005474
The intensity of the vortex was found to reveal a roughly 60-year periodicity affecting the evolution of the large-scale atmospheric circulation and the character of SA/GCR effects.
http://onlinelibrary.wiley.com/doi/10.1029/2012GL052885/abstract
The phase of the 60-year oscillation found in the tide gauge records is such that sea level in the North Atlantic, western North Pacific, Indian Ocean, and western South Pacific has been increasing since 1985–1990.
http://onlinelibrary.wiley.com/doi/10.1029/1999JD900461/abstract
The first mode is oscillatory, with t in the narrow range 60–80 years. The spatial pattern of this multidecadal mode implies coherent oscillations over Europe and over northeastern North America, with maximum amplitudes in Europe; over northwestern North America this mode is absent.
http://www.nature.com/nature/journal/v367/n6465/abs/367723a0.html
Singular spectrum analysis of the surface temperature records for 11 geographical regions shows that the 65–70-year oscillation is the statistical result of 50–88-year oscillations for the North Atlantic Ocean and its bounding Northern Hemisphere continents.
http://www.terrapub.co.jp/journals/JO/pdf/5801/58010035.pdf
While 20th Century PDO fluctuations were most energetic in two general periodicities—one from 15-to-25 years, and the other from 50-to-70 years—the mechanisms causing PDO variability remain unclear.
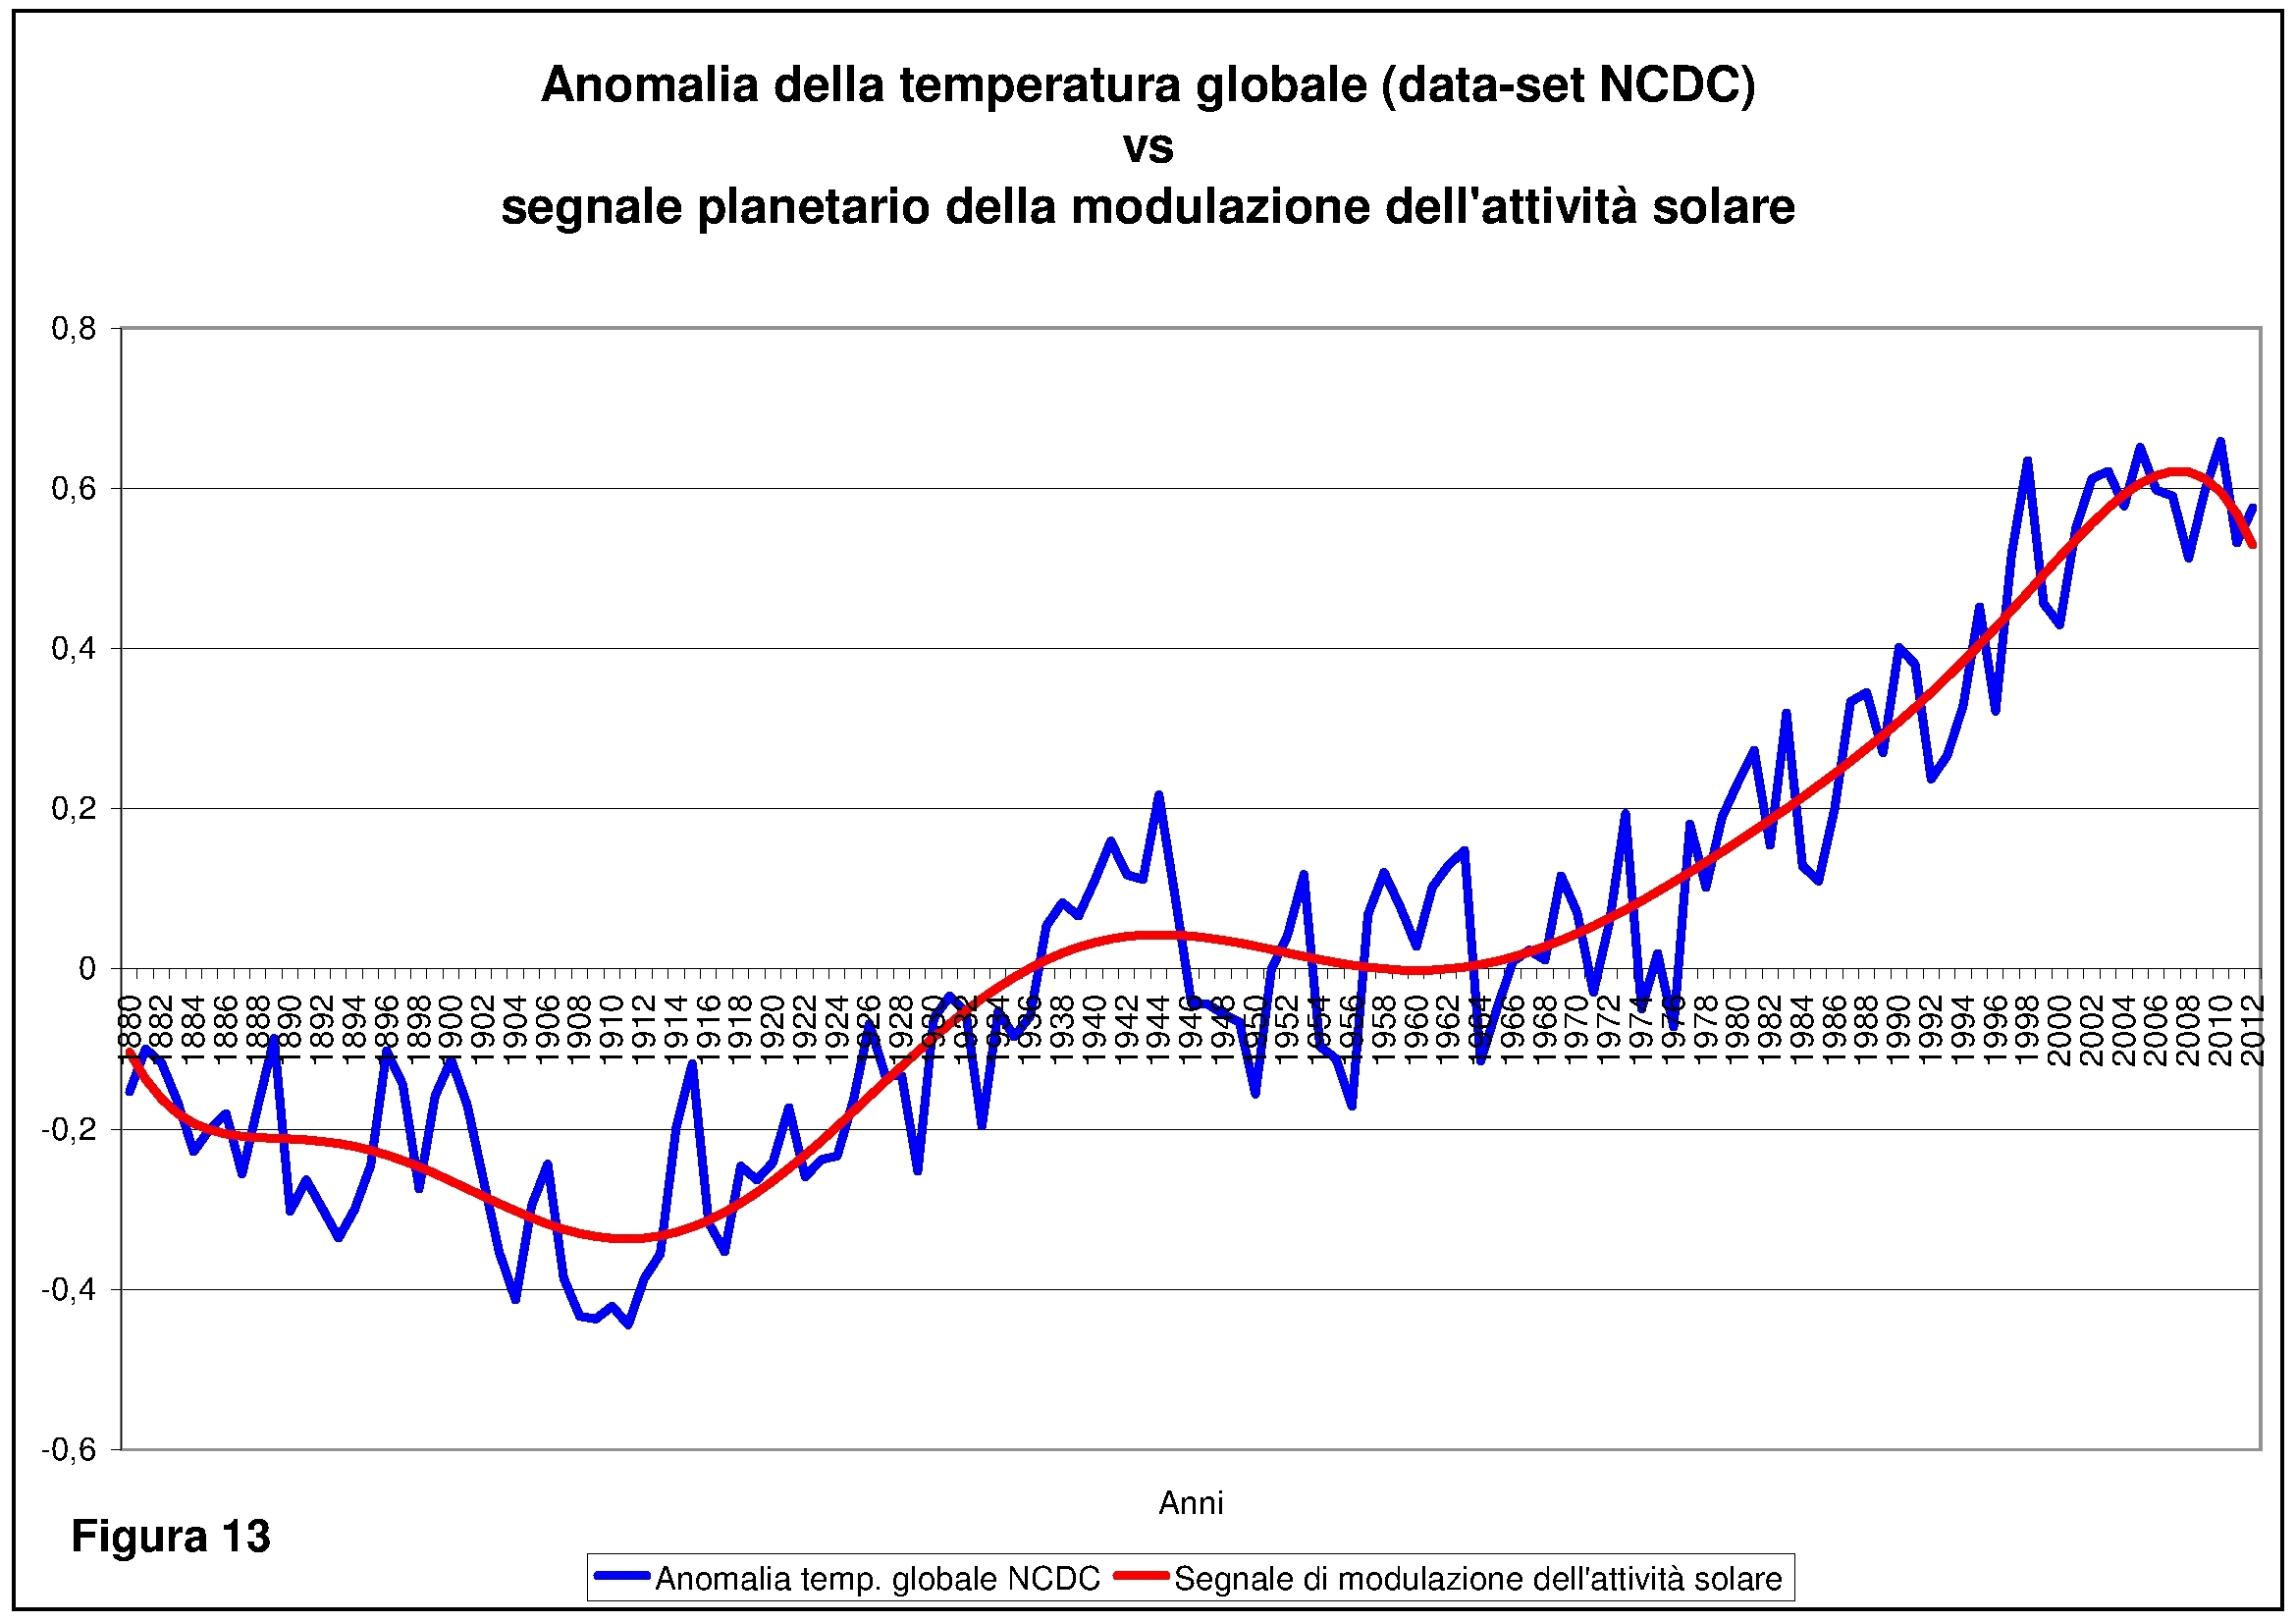
Poi ci sarebbe anche un passato lavoro pubblicato su climatemonitor (vedi immagine in apertura) con relativa formula e segnali da sviscerare ….
y=∑A*cos(2*∏*(x-x0)/T-p)
http://www.climatemonitor.it/?p=31974
Michele